Illustrations are a powerful way of conveying information in science. We all know the feeling of coming across an image, display, figure, or illustration that grabs your attention and conveys a complex idea in a direct and accessible way. Though most scientists may not consider themselves illustrators, all scientists need to be able to convey their science visually.
As I have worked through my recovery from long covid, I’ve discovered that drawing is a powerful activity with many benefits. It is a mind-body practice, where the act of conveying a thought or idea onto a page requires a connection between mind and body that can be lost when reading and writing are the only ways we engage with our research. Drawing is also a practice of the growth mindset. Like other skills such as learning a language or crafting, the more you practice drawing, the better you get at it. And at least for me, drawing often leads me to a flow state, which is always enjoyable. Finally, drawing science can require a mechanistic understanding of systems that may be otherwise hidden. Bruce Hungate, who has long worked with the illustrator Victor Leshyk, recalled a story of scientific illustration that inspired a new line of research as the struggled to render a complex idea into a visual form. The cover image of this post is one of many that Victor Leshyk has made for the ECOSS at NAU.
This summer, we are going to draw our science. As our lab group meets this summer for journal club. we’ll spend two weeks on each paper, with the first week consisting of a traditional journal club-style discussion, and the second week, considering the same paper but spending our time drawing.
The subject of the drawing can be inspired by any part of the paper. Here are some ideas, though this is not a complete list:
- draw a general topic, like root-microbe interactions in soil
- draw a concept that represents a finding in the paper
- draw or copy a display from the paper
- draw a diagram of one of the methods used
- make a stylized version of one of the data sets
- look at related papers for inspiration
Below are some scientific illustrations that I have found inspiring. Ours don’t have to be so detailed (in fact, that would be nearly impossible in just an hour). For this activity, try reducing some of the detail, or focusing in on one part of the idea.

The above figure is from Hungate et al., 2015. Though you have to do a lot of reading to interpret this methods flow chart diagram, the use of the illustration really helps to understand this method.
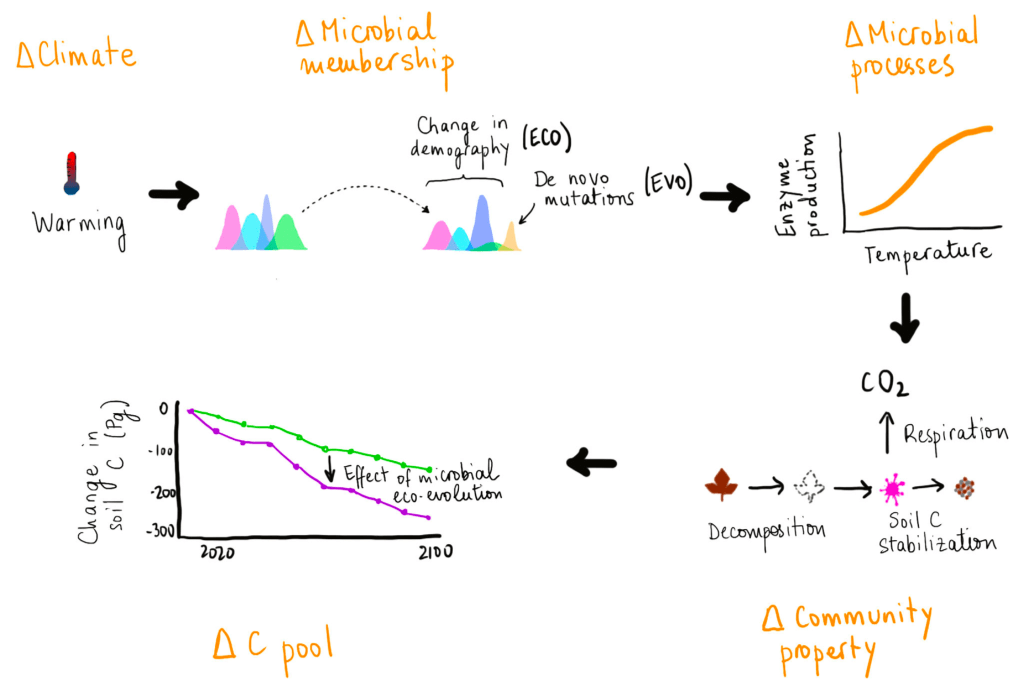
The above image is from a talk that Elsa Abs gave when she presented her work described in Abs et al., 2024. I love how Elsa Abs drew this in her notebook, but its colorful, legible, and gets the idea across.
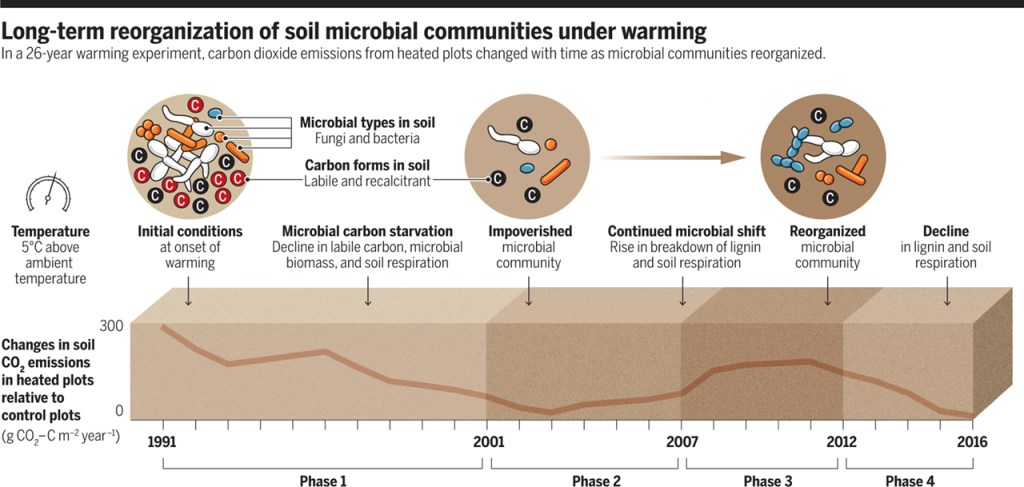
I always liked this graphic by Daniel B. Metcalf summarizing results from Melillo et al. 2017. Though it is meant more for reading close up, but sometimes including a lot of text can be effective.
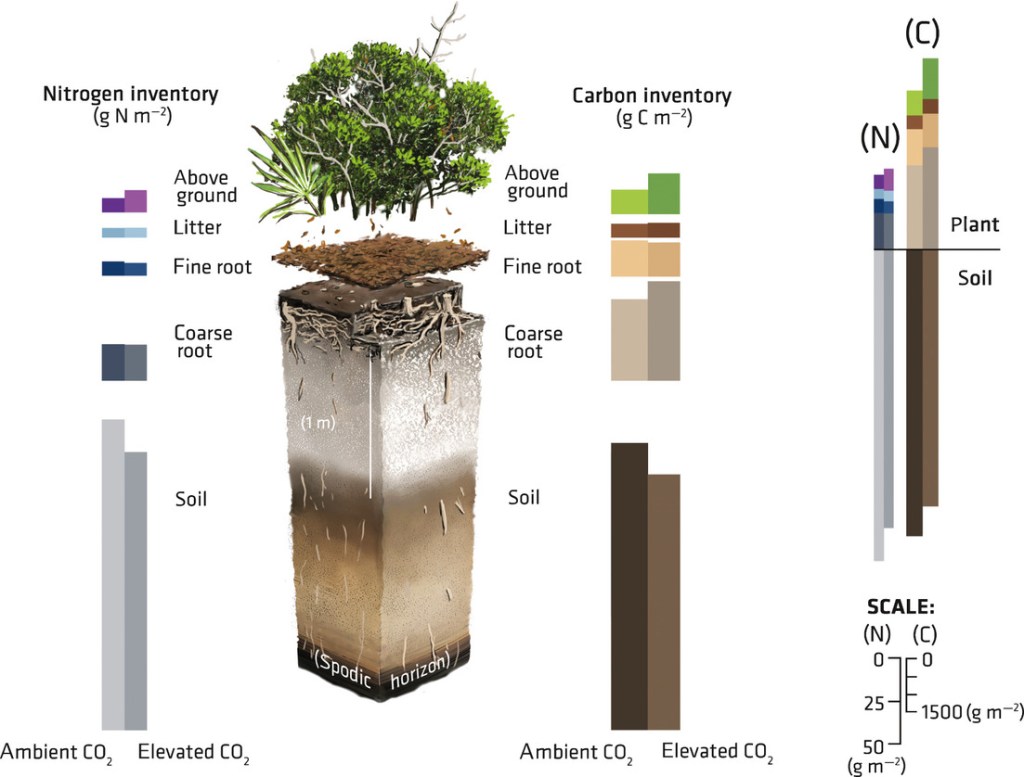
The above image is from Hungate et al., 2013. I like how the graphic of the soil horizons across depth are lined up with the data.
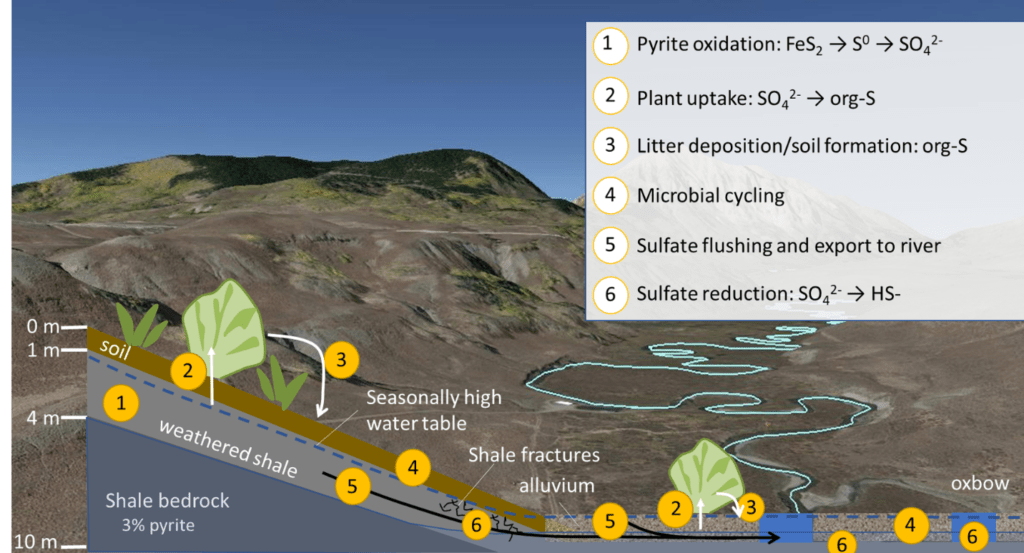
This display from Fox et al. 2022 effectively combines illustration and photography.
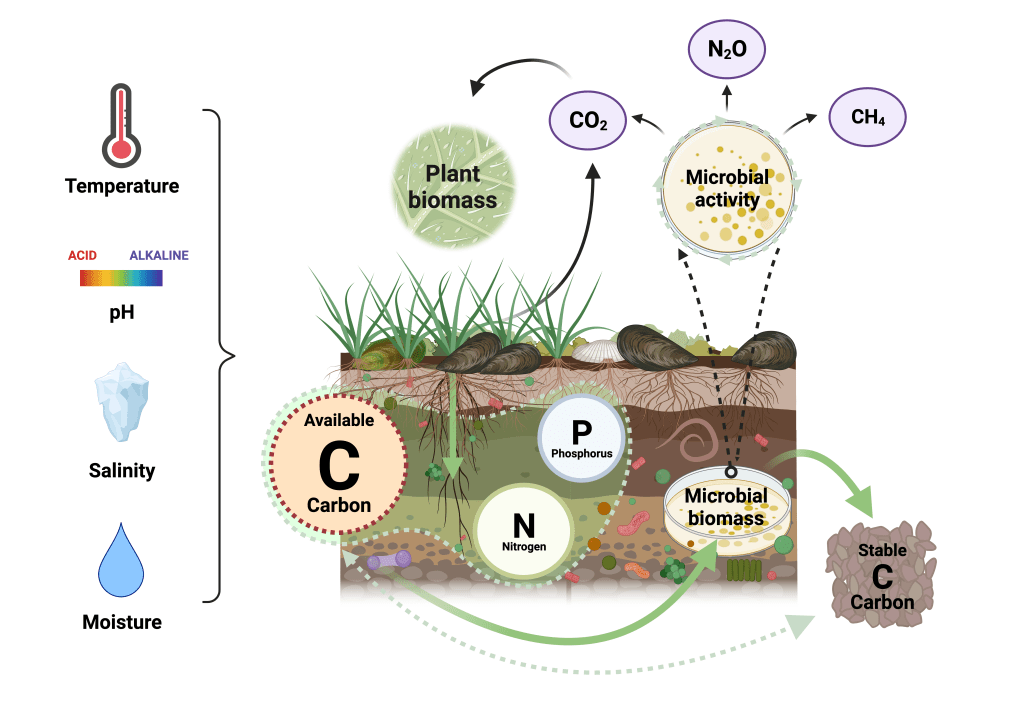
Hailey Erb made this nice display using BioRender for her masters thesis, which is in press in the journal Sustainable Microbiology! Which, if you haven’t tried BioRender yet, you’re missing out.

This display was created for the new BioEPIC (Biological and Environmental Program Integration) Center at LBNL.
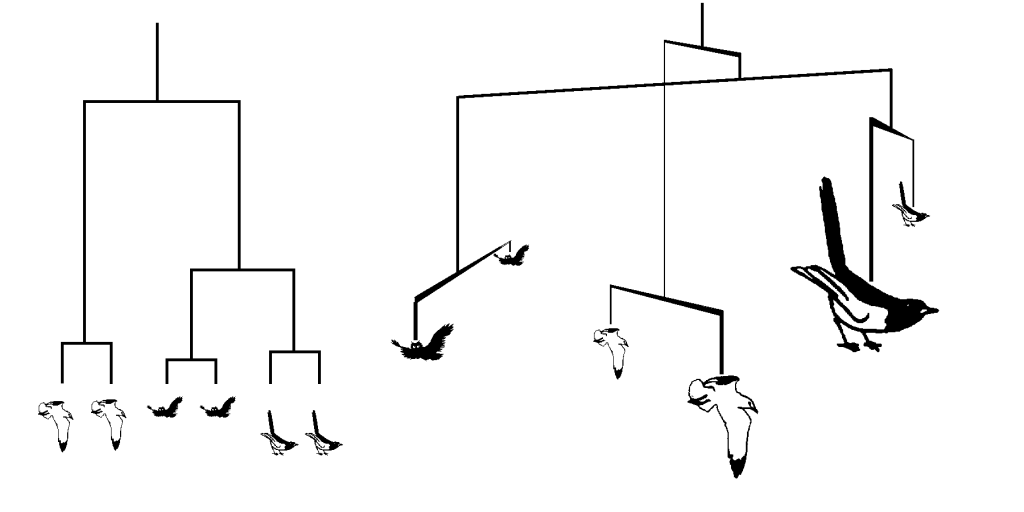
This effective display from McCune & Grace 2002 (a classic text for community ecology) illustrates how to read a phylogenetic tree in a very simple way.
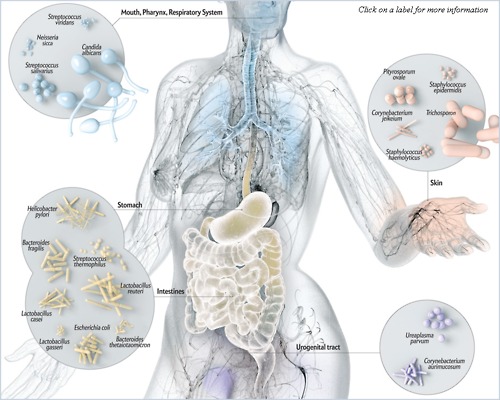
I love this illustration of the diversity of the human microbiome, though I’ve lost the source of the image.

Illustrations can expand, collapse, or otherwise manipulate scale to show complex dynamic systems, like this illustration above that shows how the universe was thought to develop from the Big Bang.
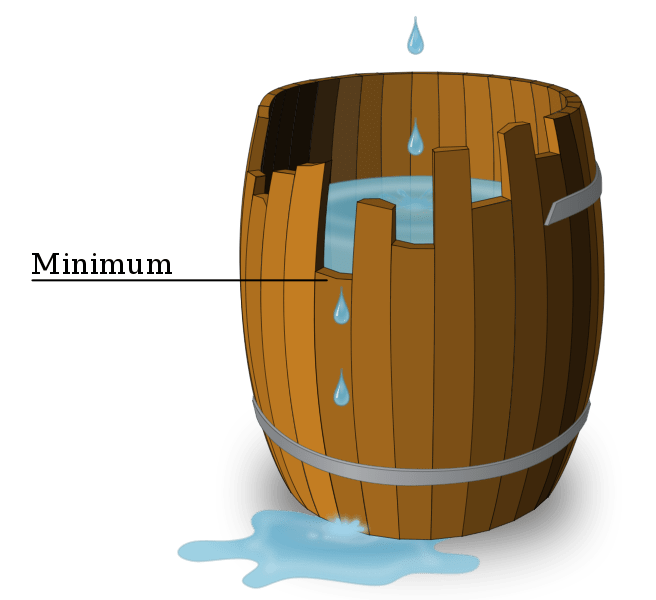
This simple diagram conveys a fairly complex ecological theory: Leibig’s Law of the Minimum. Nutrient demand is more complicated than this, but the idea gets across.
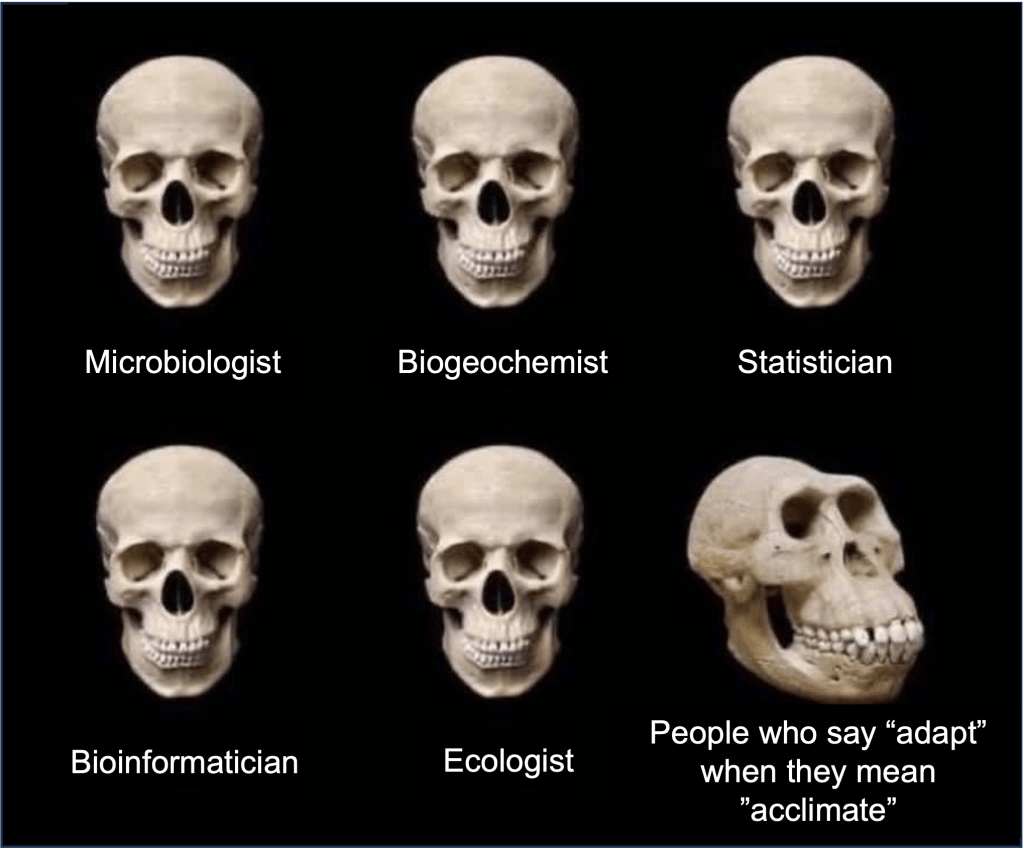
Memes can be an effective way of communicating scientific topics. I was pretty proud of this one that I made for a talk last year to distinguish between the different uses of the word “adapt” in ecology and evolution.
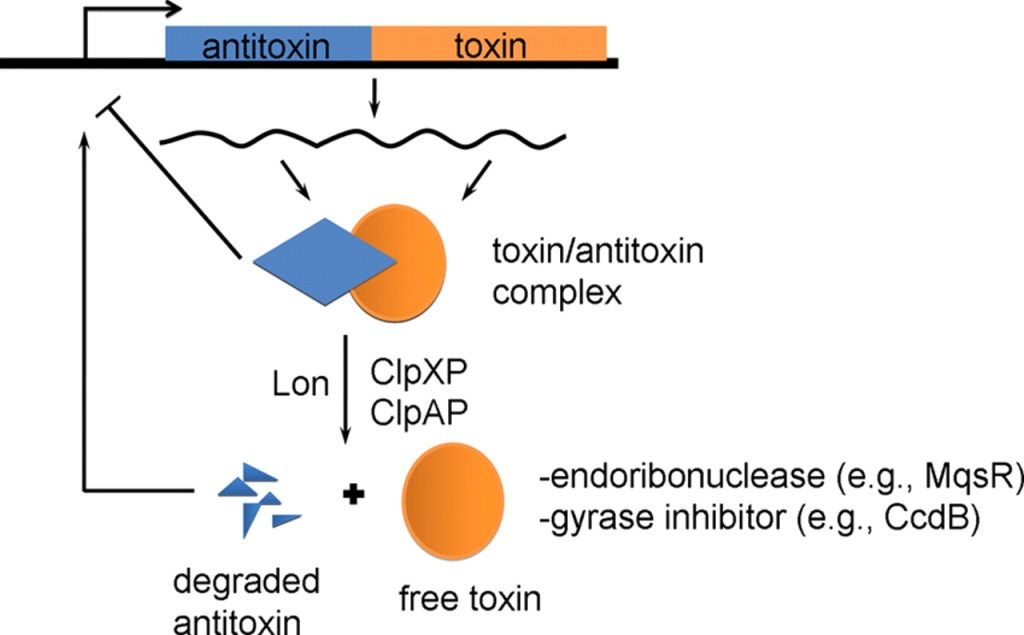
Powerpoint or other software can be used to effectively illustrate complex ideas, like this depiction of the mechanism of toxin-antitoxin gene pairs.
You don’t have to be an artist to be good at illustrating your science, and there are no rules on what kinds of tools or media you need to use. Don’t worry if it’s not perfect– it’s more about the process. So have fun drawing!

